Free
$0The public daily shortlist and weekly recap.
Included
- Daily Top 5 stock rankings
- Limited model scores and risk labels
- Daily article with the full writeup for the #1 stock
- Daily Top 5 crypto rankings
- Weekly recap email
How It Works
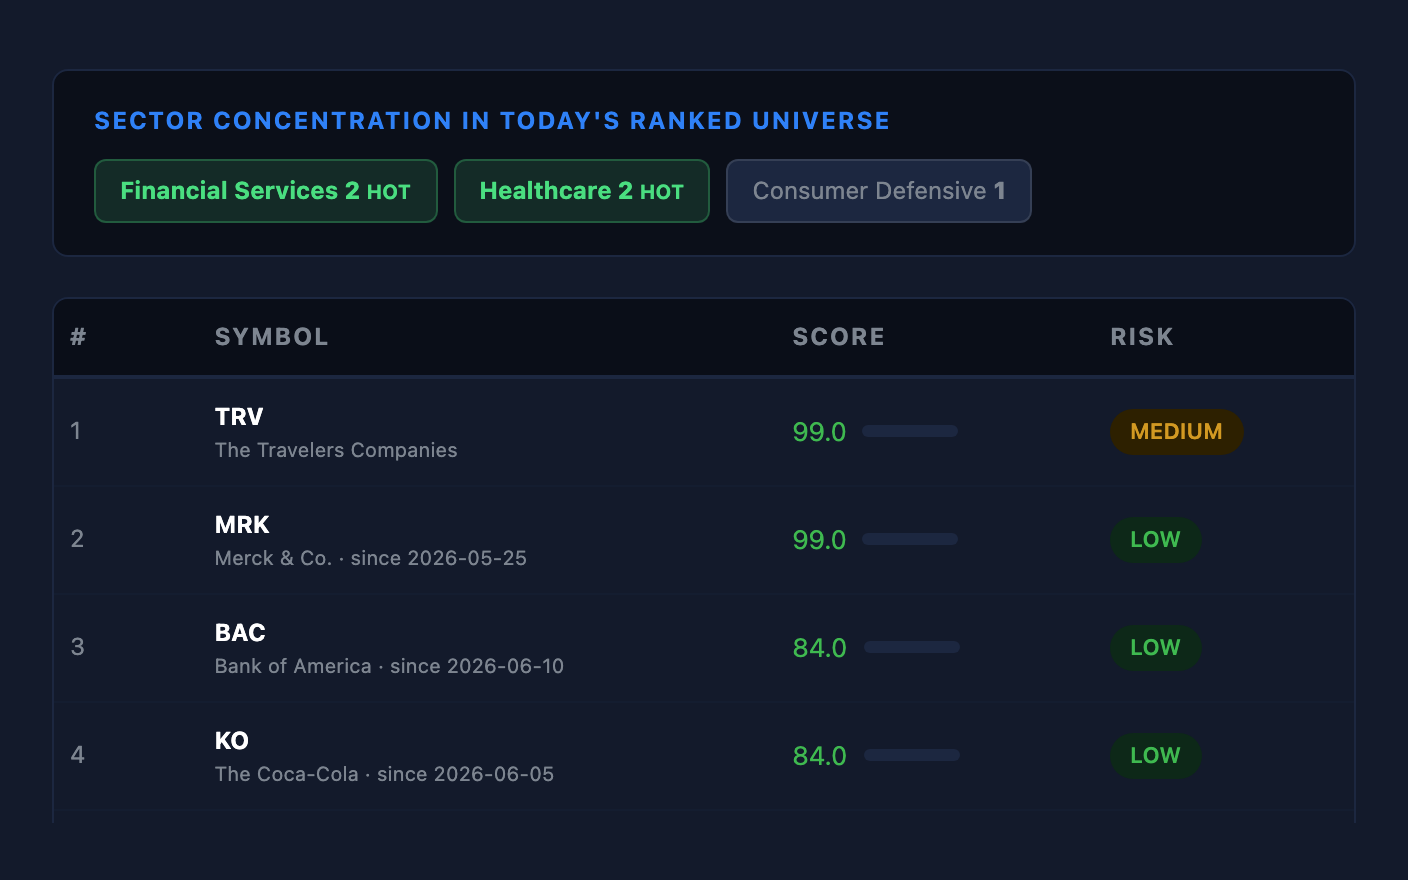
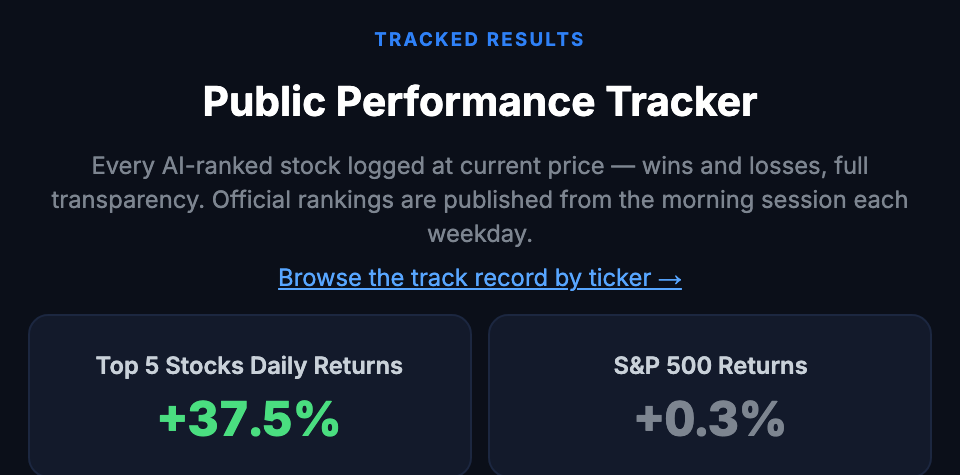
Each market day, the model scores hundreds of stocks and publishes the top five. Every entry is recorded the moment it's published and tracked until it exits — so you can check the results yourself, not take our word for it.
See it in action
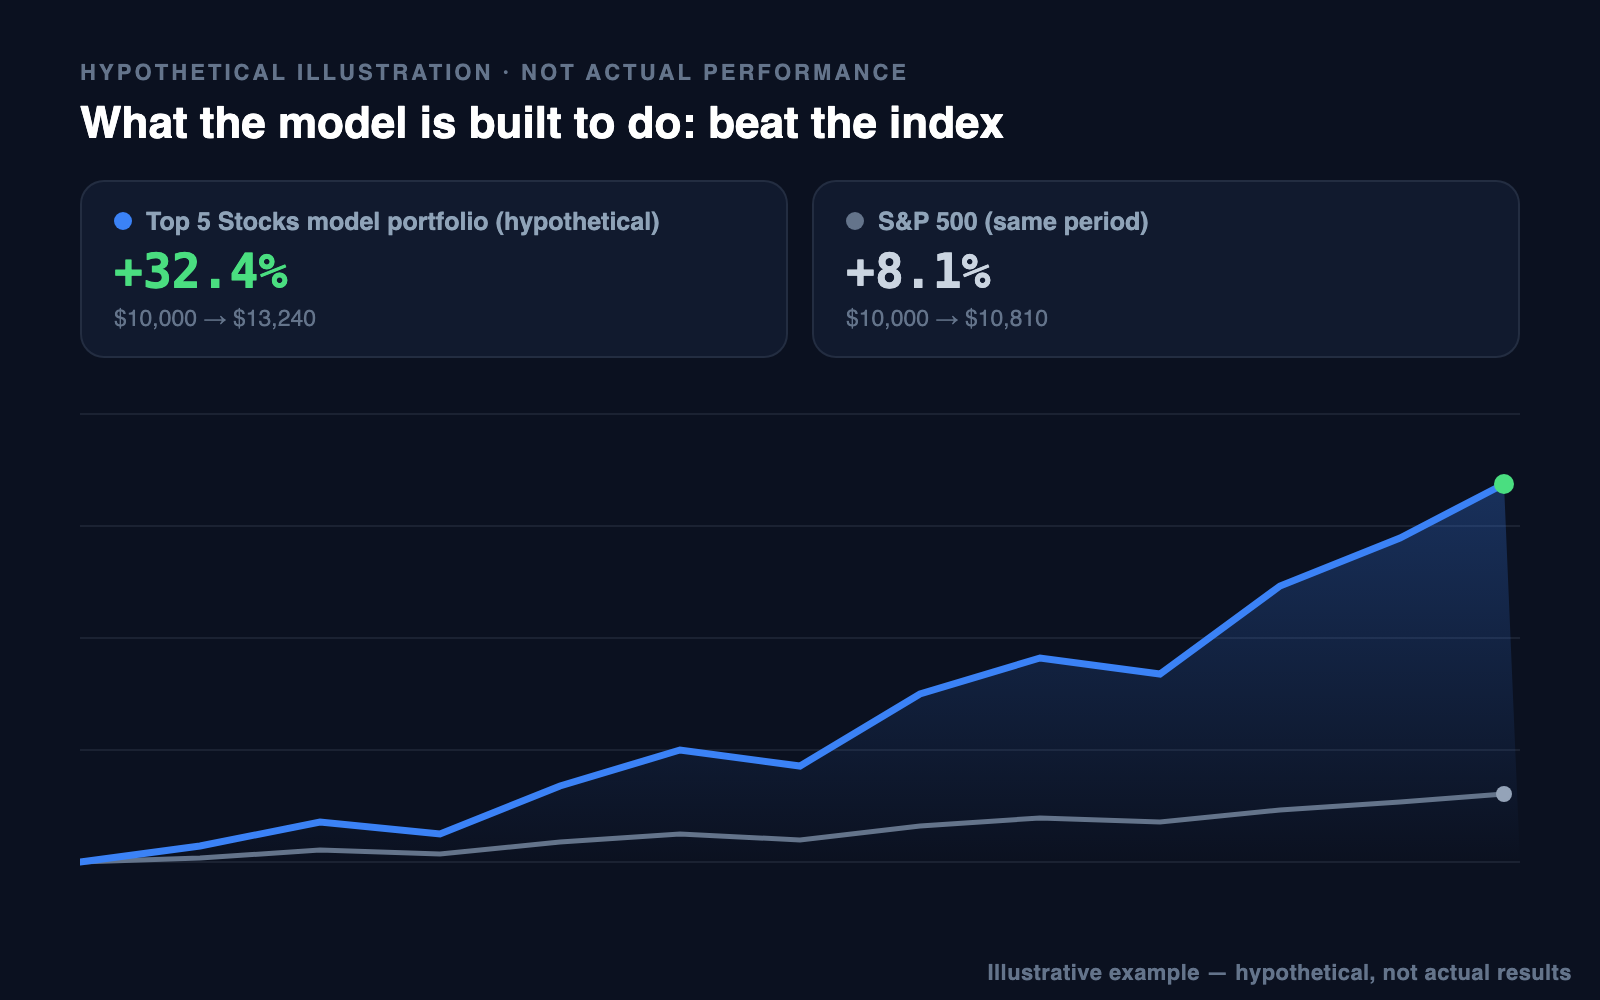
The same daily work shows up as a ranked screen, a public record, and a simple briefing you can read at a glance.
The Product
Top 5 Stocks is a fully automated, AI-driven market research service. Our system analyzes market data every day, selects the top-ranked stocks and cryptos, generates a narrated video, and publishes it.
We're not a brokerage, not a hedge fund, and we don't manage anyone's money. We publish selections and educational research. What you do with the information is up to you.
Channels
Our AI publishes across multiple channels daily:
Selection
We run three separate AI pipelines: short-term momentum, long-term value, and a monthly generational screen for durable compounders.
Published every market day. 5 stocks scored on short-term signals. Each entry is tracked until the upside or downside reference level is reached. Entries are short-term and typically reach a model exit within a month.
The production preview scans 900 large and mid-cap US stocks (S&P 500 + S&P 400) for quality companies trading below estimated fair value. Full Ultra delivery opens only after SEC and licensed-price readiness checks pass; the official five-name selections are tracked for up to 365 days, unless the model records an earlier AI MODEL EXIT RECORDED event.
The Generational screen is a conditional Ultra preview: at most 2 selections per month. Candidates are observed across a full month of scans and must qualify on the majority of them before selection — one strong day is never enough. Selections are tracked indefinitely with no exit levels; months where no company meets the bar are recorded and published after readiness is confirmed.
Rankings are locked at publish time and cannot be edited retroactively.
Automation
How the pipeline works:
Scan & Score — Market data is pulled from multiple APIs. Every stock is scored and ranked.
Script Generation — A deterministic system builds each ranking's narrated line directly from real catalyst, news, and data facts; an LLM only writes the one-line market intro.
Video Render — Text-to-speech narration is synced with dynamic stock charts and data overlays.
Publish — The video is uploaded to YouTube, the website is updated, and paid members may receive model-event alerts if the Telegram beta is open and enabled.
Tracking
When a stock is selected, the model logs an entry at the current market price and sets two reference levels: an upside level and a downside level. These levels are derived from the model's analysis — they are not trade instructions.
The model then monitors the stock. Momentum level events close short-term tracking; Undervalued level touches remain research context and risk markers while the value thesis develops. An AI MODEL EXIT RECORDED event or the strategy's time horizon closes the tracked result. No actual trades are placed — this is a simulated tracking system for transparency.
An equal-weight basket of 5 stocks is selected each market day. Each entry stays active until a reference level is reached. Most entries resolve within 1–2 weeks. The model records an exit in one of three ways:
The official five-name value basket is tracked for up to 365 days so the thesis has time to develop. Upside and downside levels are shown as research context; touching either one does not automatically close a value selection. Tracking closes earlier only when the model records an AI MODEL EXIT RECORDED event.
Measurement
We track two types of returns:
The simple average return across all individual closed rankings. Shows what a typical single ranking returned.
A hypothetical $10,000 model portfolio using simple additive returns. Each daily basket is measured from its recorded model entry to its AI MODEL EXIT RECORDED price, and the percentage result is added to the running total. Only baskets with 2 or more fresh (non-repeat) rankings are included to avoid double-counting. This is not compound growth — each basket's return is independent.
The benchmark line shows a hypothetical buy-and-hold investment in SPY starting from the same date as the first basket, so readers can compare the model record with the same-period S&P 500 result.
Each individual ranking is also compared against SPY over the same holding window to calculate excess return vs the market.
Transparency
The published record starts on August 3, 2026. We changed the scoring model, and the results before that date came from a different one — leaving them up would tell you how a system we no longer run used to do. So the record restarts with the model that actually picks today's five. Earlier research is still kept privately for our own analysis.
From that date on, everything eligible we publish stays on the record — the good calls and the bad ones. Because it starts fresh, it will be thin at first and build up day by day. You can watch it fill in on the Track Record page.
The point is to give you something you can check for yourself, instead of a marketing number you have to take our word for.
Accountability
Top 5 Stocks is independently built and operated — one developer, one automated research system, no outside sponsors and no one paying us to feature their stock. The scoring models are backtested across multiple market regimes before any weight changes ship, and the publishing pipeline records released rankings for the public track record.
We publish under the same handle everywhere — @Top5StocksDaily on YouTube and this site — and the customer-facing record since August 3, 2026, including gains and losses, is one click away. Questions or corrections: top5stocksdaily@gmail.com.
Plans
The daily public research remains available without a paid plan. Membership tiers add more context and tools:
The public daily shortlist and weekly recap.
Included
The complete daily briefing, delivered by email.
Everything in Free, plus
The full available ranked stock list and the market context behind it.
Everything in Starter, plus
7-day free trial included. Cancel anytime before day 8 and pay nothing.
View Pro details →Preview longer-horizon research while source-safe production checks are completed.
Everything in Pro, plus
Ultra is currently waitlist-only. Paid delivery opens after the same SEC and licensed-price readiness checks used by the research exports pass.
View Ultra details →The rankings and the full record — wins and losses — are public.